A Quantitative Electroencephalogram (QEEG), also known as a Brainmap is a assessment technique that has benefits for neurofeedback. It is a procedure where EEG (brainwave) data is gathered and then compared to an age-matched normative database. Information from a QEEG can then be used to see what areas of the brain may be functioning inefficiently, aid in developing individualized and comprehensive neurofeedback protocols, or even assist a physician in determining the best medications or supplements to recommend for various mental health issues. A QEEG can also be performed at the end of a course of sessions to measure and visualize how much improvement has been gained.
An elastic cap with 19 sensors is placed on the head so that the brainwave activity can be measured. There is no piercing of the skin. Brainwaves are then recorded with eyes closed and again with eyes open. This data is then compared to one or more normative databases. This results in a series of tables and graphs which indicate which areas have brainwave abnormalities, the degree of abnormality, and the brainwave frequencies that are involved. This makes it possible to develop specific neurofeedback protocols, unique to the individual.
Brainmaps guide efficient and effective neurofeedback by guiding where the sensors should be placed and what frequencies and/or connectivity issues should be addressed in training.
Understanding the numbers and graphics
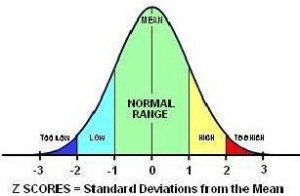
The numbers generated are z-scores which is a metric which represents how typical or atypical a score is in comparison to the database. A z-score of +1 represents a score exceeding 84% of individuals that age; +1.25 exceeds 89%; +1.5 exceeds 93%; +2.0 exceeds 98%.
A combination of tables and graphics of z-scores are generated for either the traditional EEG bands (e.g. Delta 1-4 Hz.; Theta 4-7 Hz.; Alpha 8-12 Hz., Beta 12-25 Hz, etc.) or for specific single Hz. bins to enable increased precision.
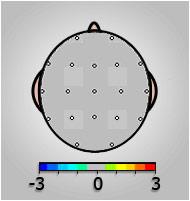
The heads use colors to represent the z-scores at the 19 sites, with the nose on the top. Grey represents scores that are normal (+/- 1 Z score). The dots on the head are electrode sites (e.g. the top two being prefrontal sites)
ADHD Child’s EEG (8yrs old)
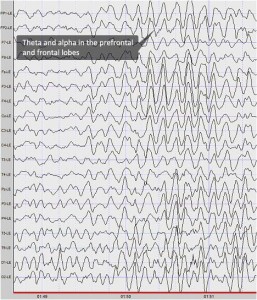
Here is an example of three seconds of EEG recorded at 19 sites which shows the brain making normal brainwaves to start but then shifts into a dysregulated state where it makes the larger, slower brainwaves (theta). This dysregulated state is likely occurring when this ADHD child is inattentive.
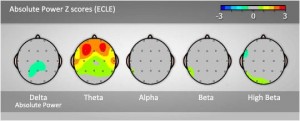
When this child’s recorded brainwaves are averaged and compared to a database we find that he is making more theta activity in the frontal and prefrontal sites is greater than 97% of children his age. This information can be represented in graphs as seen below.
Same ADHD child’s EEG represented graphically
We can see his excessive theta activity in the graph below:
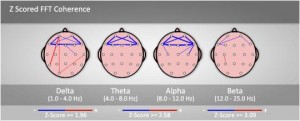
Connectivity: A measure of how the various parts of the brain communicate with each other
Brainmaps provide a great deal of additional information in a variety of tables and graphs. In addition to measures of the power of the EEG at various speeds, the Connectivity measures give information about but about how well one part of the brain is communicating with another part of the brain.
The coherence topographic images below, for an adolescent with ADHD and Obsessive Compulsive Disorder, illustrates the brain having difficulties with effective communication between various prefrontal and frontal lobe sites.
